3-Touch Support
Extended Discussion
Note: Some readers might benefit by first reading the shorter version of this article which focuses on the core strategy, and then return here for an extended discussion.
Trend lines often act as support lines for prices. Provided the trend line is properly drawn, you can see why it has this name. You expect the line to 'support' the price. In other words, a support line exists when traders won't let the price fall below it.
It is really quite amazing how many times prices will drop to touch this line before resuming their climb upwards. Three, five, seven touches or more is not uncommon within a short period of time. Here are a few charts, all taken from the same time period, that illustrate this fascinating phenomenon:
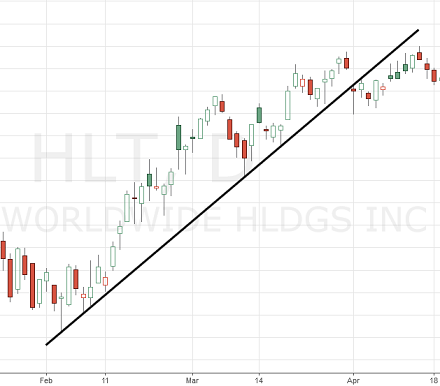
Multiple re-tests of support line (stock: HLT)
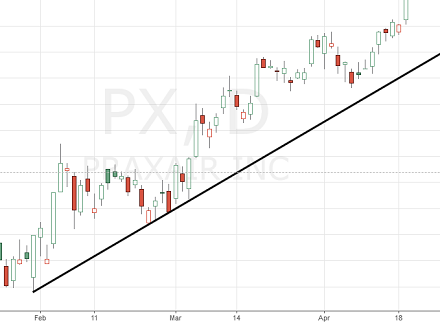
Multiple re-tests of support line (stock: PX)
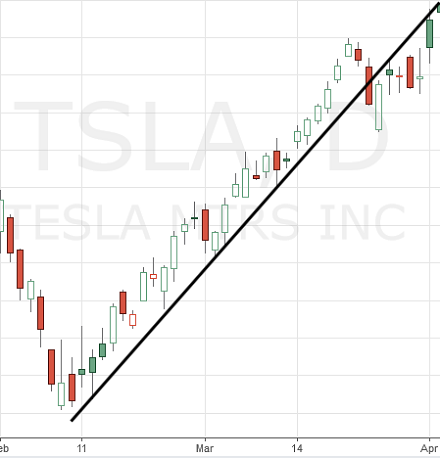
Multiple re-tests of support line (stock: TSLA)
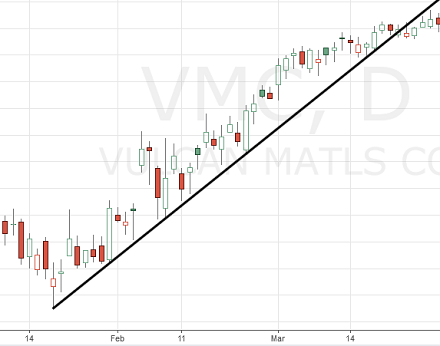
Multiple re-tests of support line (stock: VMC)
Support lines are an obvious advantage for the trader. Ideally, you enter a position when prices first show signs of support, and exit the position when they break that support level. But in reality, this is difficult to do. Even if you suspect prices have support, you can never be sure it will hold.
As a trader, the first thing to do is to draw a trend line. You start at the lowest low and draw a line to the next price low. Now, we all remember from high school geometry how it takes two points to draw a straight line. But that line only becomes a possible trend line when you can extend it, while maintaining the same slope, such that another price low touches the line. If prices subsequently bounce away from the line without penetrating it, the support line is confirmed.
Entry Conditions
According to the 3-touch support strategy, you are to buy right after the third touch of prices to the support line. Consider the following chart for stock SYK. It is from the first half of 2016. (Note that we have historical trading days calendars if you need them.)
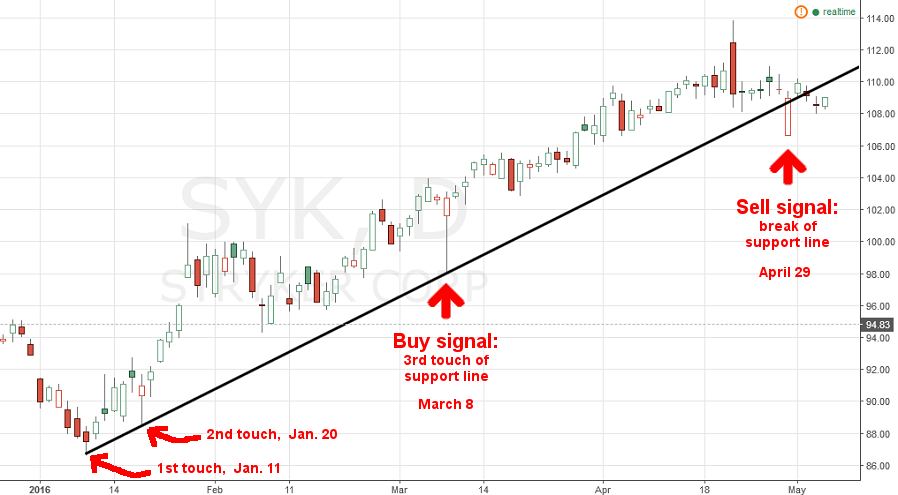
SYK stock chart with entry on 3rd touch of support line, and exit at break of support line.
Imagine the current date is just after January 20. The lowest low occurs on January 11, from which a straight line can be drawn extending past the low on January 20. If this line is a support line, we should expect that prices will return to touch, or retest, this line. Once it does on March 8, a buy order is entered with your broker.
Many technical traders would criticize this strategy for being overly cautious. They would say that to require a third touch misses out on perfectly good trends that fail to meet the third touch criteria. This is certainly true. Many legitimate trends only have two touches before they end. Further, it can be argued that two touches are even better than three or more. Why? Because this means fewer traders feel the need to retest support and so allow the stock to trend upward with an increasing slope.
Nevertheless, experience shows that you should place greater trust in a trend line with three or more price touches. By acting on just two, you are taking on more risk.
To reiterate, the 3-touch support strategy tells you to go long just after the third touch of the support line, a touch being defined here by the low of that day's prices.
Exit Conditions
As for exiting your position, the 3-touch strategy tells you to sell when the daily price low falls below the support line. In the SYK stock chart above, you would close out your position immediately following the April 29 support line breach.
With some financial instruments, including foreign exchange (forex), you often see traders pushing prices past the support line, only to immediately buy it back so that the day's closing price remains above the support line. Here is where experience comes in handy. If you lack this experience, however, you'll need to observe what matters more for the instrument you are trading: the low breaking the line, or the closing price. You'll also discover that individual stocks not only behave differently from one another. They also behave differently from themselves depending on, say, what time of year it is.
Traders thus use support lines to identify an uptrend. Prices are rising, and rising consistently. This provides confidence that the purchase of this stock is returning a profit and may continue to do so. Notice in all the charts above how on many days, the low price touched the support line, but did not cross it.
The greater the number of these daily low touches (but not crosses) of the support line, the more confidence the trader has that this line is a valid description of the upward trend. These tests of support encourage buyers to buy more after the price passes the test. In economic terms, new rounds of buying constitute demand for the stock. An accumulation of this stock begins. On the supply side, those who already own the stock are reluctant to sell it after support has passed these tests. Owners now require a higher price to put their supply of stock on offer.
As already said, sometimes traders will test support by selling down to the support line to see whether it will hold. If you just recently bought above the support line, you now have cause to worry. You'll ask yourself whether other holders of this stock will defend their positions by rushing in to buy more. If and when the support line does hold, those selling may become aggressive buyers. Because this exercise just confirmed for them that buyers outnumber sellers. This means that if you had just bought and survived this test of support, you are more likely to experience a profit.
Technically speaking, when prices penetrate the line to the downside, support has been broken. The trend is over. However, this may not be entirely true. Notice in the four charts grouped above how three of the stocks (HLT, TSLA, and VMC) have broken the support line, yet their prices continue to head up. But while this may be true, it is important to understand how the existing trend line is no longer reliable. The 'break' of support can very much be read as some holders of the stock 'breaking rank' with other holders to sell at progressively lower prices.
Breakouts
In trading parlance, what occurs is a breakout – a penetration of the support line by a candlestick. As already implied, some traders require that the close must break the line to qualify as a breakout. But regardless of how it's defined, the word is usually used to refer to a significant violation of the trend. Sometimes, however, breakouts appear to quickly reverse themselves. Yet if a genuine breakout has taken place, the trend has fundamentally changed its nature, and this usually signals an impending change of direction. So on the one hand, if a downside breakout of support is immediately followed by a series of higher highs, it may indicate that the bulls have gotten a second wind and are repudiating the breakout. But on the other hand, such moves after a downside breakout are uncommon, so it is safer to assume the trend has reversed course.
There is, however, the phenomenon of the false breakout, whereby prices extend beyond the support line for just a day, only to obediently fall back in line. After the temporary breach, prices continue to respect the support function of the line. What is therefore 'false' about a false breakout is only the conclusion traders draw from it, because prices really do break the line.
One way to gauge whether a breakout might be false or not is to consider the closing price on the day just before the breakout. In an uptrend, if the close is at or near the high for that day, odds are good that it's a false breakout. This is because the breakout was likely due to profit-taking that got carried away, or was triggered by a rumor, or was just due to some random event. But if the closing price on the preceding day is at or near its low price for the day, chances are the breakout is real.
In the end, if the support line is confirmed to be broken, make sure you discard it as a trading tool. But then again, you may want to leave it on the chart if you plan on trading the same stock as it swings back downward. Often times, old support becomes new resistance and vice versa.
Like this strategy? Here are a few more.
Or start building a complete trading system around it today.