Short on Four
Before turning to examine what this trading strategy involves, let's take a moment right at the start to drive home an important point about trend lines.
Trend Line Adjustment
The point is simply this: you need to have extraordinary patience and persistence while working them. Why? Because trend lines need to be adjusted every so often. This can happen for a variety of reasons.
Here is one reason:
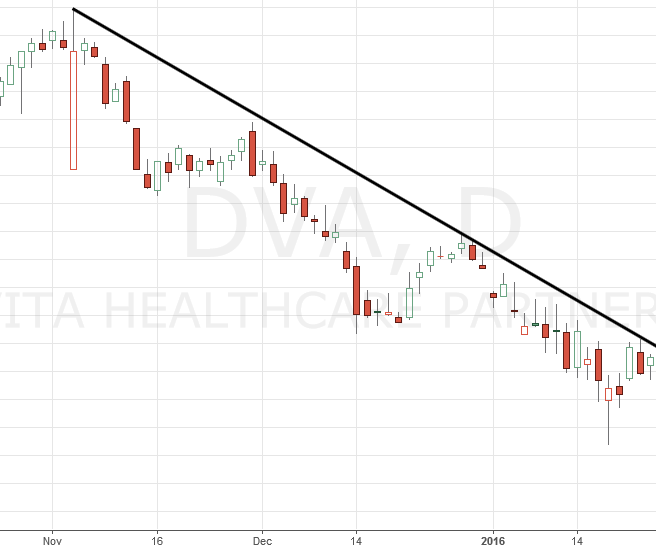
DVA stock chart with trend line.
This chart represents a stock in a clear downward trend. Prices nicely touch the trend line in four places, which lends confidence that the line also acts as a resistance line. That is to say, prices appear to have trouble breaking above this line.
However, on Jan. 27, it does just that:
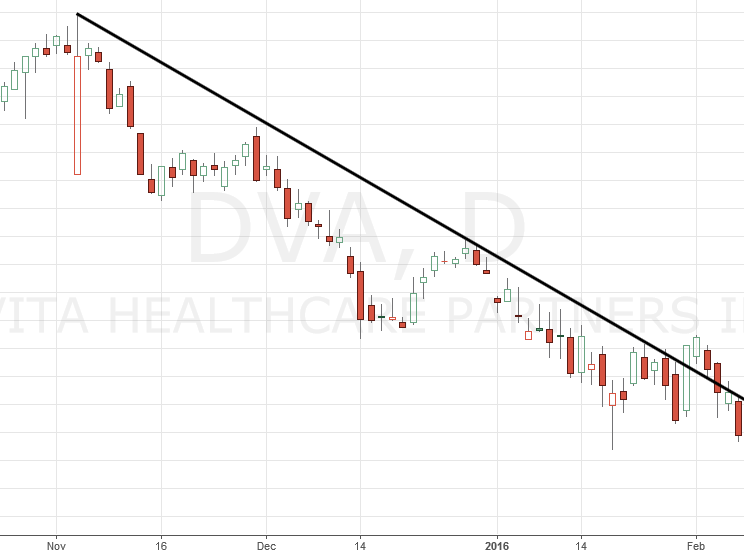
DVA stock chart with trend line broken upward.
The initial price breach is slight. And the next day it seems prices resume their previous pattern, remaining wholly below the trend line and with the day's high just touching that line.
The following days are a different story. For two consecutive trading sessions prices remain above the line. At this point, the break of the trend line becomes undeniable.
Yet by Feb. 2, prices seem to be declining again overall.
The question to ask is: given this chart, should the trend line now be redrawn?
According to the method of drawing trend lines recommended on this site, the answer is no. A trend line should always touch its final point somewhere prior to the lowest low. This condition would not be satisfied if you were to pivot the line upward to the high point on Feb. 1, since the lowest low point comes before this day, on Jan. 20. So unless the particular trading strategy you are using calls for taking a position at this time (possibly going long because of the resistance line breach), you would need to take a wait-and-see approach to this particular stock.
But you would not have to wait long. Because on the following day, prices make a new lowest low:
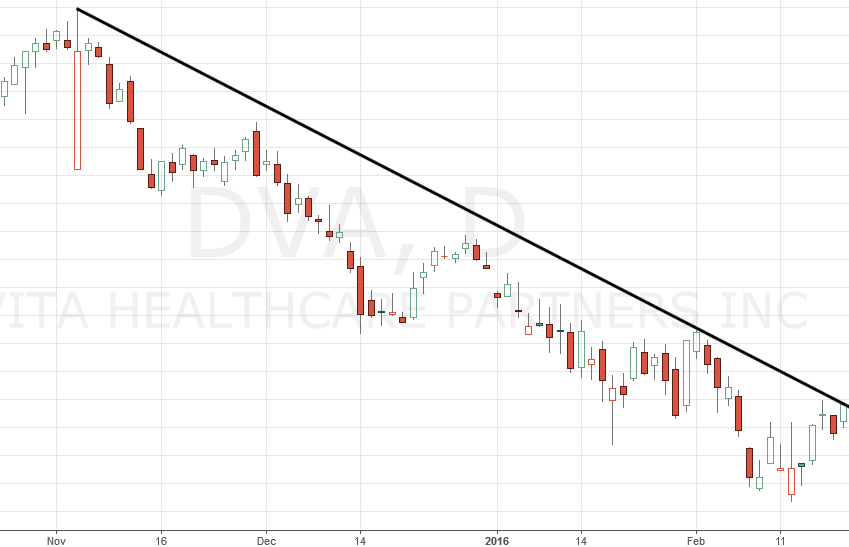
DVA stock chart with a newly drawn trend line.
With a new lowest low on Feb. 8, the trend line would definitely need to be redrawn. This is because the old trend line would intersect prices between its first and last connecting points and this is forbidden in properly drawn trend lines. The newly drawn trend line would remain valid as prices subsequently make even lower lows on Feb. 9 and 12. At this point, you would need to wait and see if the line qua resistance will continue to hold back prices, as it has apparently done on the last day shown on the chart, and for how long.
So what's the strategy?
Now that you have an idea of the need to stay vigilant with your trend lines, let's see what the 'Short on 4' trading strategy is all about.
As implied above, you are hardly ever lucky enough to get clear indications of a change in trend. A stock will not trend upward along its support line, to then break out of that support line and turn into a downtrend with a tidy resistance line, all that often. Far more often the price will wander around a bit, perhaps testing the last high. This can be quite annoying, especially if you sold at the break of support.
(For this reason, you should also understand that when charts are used to teach trading principles and to illustrate trading techniques and strategies, they are just that: heuristic devices. They should be selected to just get the point across and nothing more. They shouldn't give off the impression that all stocks behave in that way. So be wary of sites that only use charts, particularly artificial ones, where all the elements fall into line and seamlessly jibe with what the text is talking about. Reality is not that neat and tidy. It is always better to learn directly from what the real markets have to teach, rather than from the ideals technical analysts set for them.)
Consider the following chart:
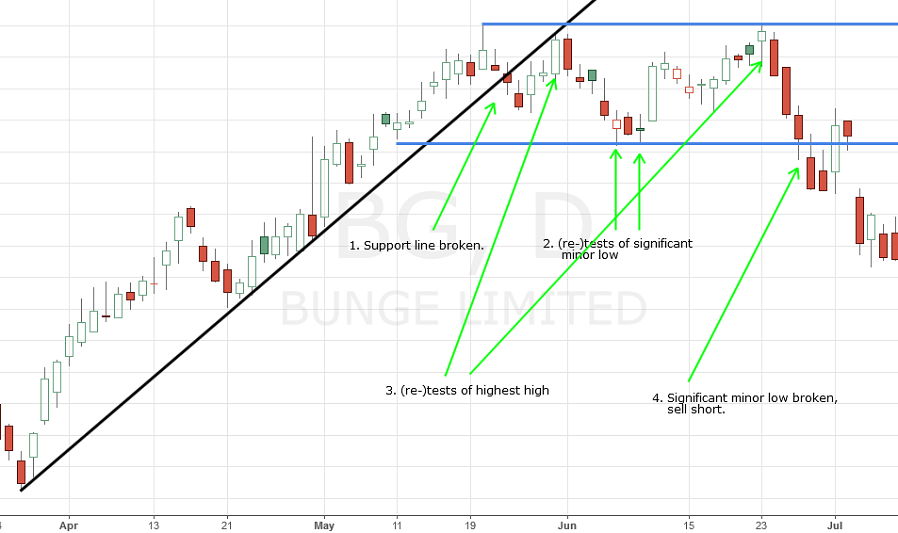
BG stock chart with sell short signal on break of minor low price level.
The first major event in this chart is the break of the support line. But instead of seeing a sustained inverted V-shaped down move right after, the price goes on to test both the highest high, and a significant minor low point which occurred during the previous upward trend. It is only when prices cross under this previous minor low point that you can be fairly certain that the move is over and a new trend is in play.
To reiterate in step-like fashion, here is what to look for when an uptrend changes into a downtrend:
- Prices break the support line downward.
- Prices test (possibly repeatedly) a significant minor low point formed during the uptrend.
- Prices test (possibly repeatedly) the highest high of the uptrend.
- Prices break the price level established by the significant minor low point.
Note that steps (2) and (3) could occur in reverse order. The important thing is that prices appear 'caught' between the two levels established by the highest high and the significant minor low. It then becomes a major event when prices break downward through the lower price level.
According to the short on 4 strategy, you are to sell short once step (4) has been made.
Not every break of support follows this exact pattern. But it is a useful model to learn, not least because it reminds us that trends hardly ever end and reverse direction in one sudden motion.
Pullbacks
Technically speaking, the set-up to this trading strategy is called the pullback. Pullbacks are one of the most irksome and vexing phenomena in technical analysis. They are also alternatively called retracements or corrections. In other contexts, these latter terms have different meanings. But pullback has fewer meanings.
A central characteristic of the pullback is a roughly sideways movement that occurs after a trend line breakout. Quite often, it occurs just before it as well. The pullback is symptomatic of congestion – a term aptly describing market traders milling around like holiday shoppers in a crowded mall trying to dodge one another, but who only succeed in impeding the general progress of everyone involved. Still another term for such a sideways price movement is consolidation, which refers to market traders consolidating their ideas about the particular financial instrument being traded. Often, consolidation precedes a breakout of the trend line.
Essentially, congestion and consolidation describe the same market phenomenon: trendless prices trading within a definable range, as in the case above where stock BG bounced between a previous high and low for around 23 trading sessions (or just over a month). Consolidations not only precede a breakout. But they also often follow a breakout.
Here's a trading tip: if you observe a sideways price movement, but can't identify the trend, zoom your chart out so that it covers a longer time frame (e.g., switch from a daily to a weekly chart). Odds are that either a breakout has just happened, or one is just around the corner.
More on Support and Resistance Lines
Once the trader understands the concepts of support and resistance and begins to use them in his technical analysis, the lines themselves become the focus of attention rather than the trend. Traders make decisions to buy and sell because of what happens to the line, often times without anything really happening with the underlying trend.
Support and resistance is quite well-known to today's trader. These lines occur so frequently on their charts that they have largely become a self-fulfilling prophecy. Many traders draw and trade according to the same lines. On the one hand, owners want to defend the price because they want to see the price of their shares survive the test of support and thereby encourage additional buyers to bid up the price to higher levels.
On the other hand, potential buyers want the price to fall so they can purchase the stock more cheaply, or to cover their short positions. The professionals in the market usually know where the amateurs have placed their buy and sell orders. As amateurs, they often place these orders at round numbers and other obvious support and resistance levels. The former group can then easily pick off the latter for a quick buck. The professionals can and will push the price under a support line just enough to scare the amateurs into selling. But knowing these games is not enough to completely avoid all the negative consequences. For instance, if you don't place your order at an obvious support or resistance level because you no longer want to be a sucker, you might very well miss an entry or exit at the best price.
So it's not enough to simply draw good and valid trend lines to maximize your profitability. You also need to study how often traders of your particular financial instrument spook at resistance levels, or break support by just a hair only to bid the price up afterward. In the end, it's not the line that counts, but the psychology of those folks who created the line.
Like this strategy? Here are a few more.
Or start building a complete trading system around it today.