3-Touch Resistance
Trend lines often act as resistance lines for prices. As long as you draw the trend line properly, you can see why it has this name. You expect the line to 'resist' price movements beyond it. Said otherwise, a resistance line exists when traders prevent prices from rising above a certain point.
Since resistance is the mirror image of support, you can simply reverse strategies based on support lines to generate similar strategies using resistance lines. The 3-Touch Support strategy, for instance, can be reversed to produce a mirror 3-Touch Resistance strategy. To keep this discussion fresh, we'll leave the exact details of this reversal to you. We'll focus instead on some special considerations that arise when traders use resistance lines to enter and exit trades.
The Significance of Resistance Lines
A resistance line is a line drawn along a series of daily high price points where buyers resist buying more. The price is simply too high for them. At these points, the expectation is that sellers will emerge at the resistance line to take profit.
As a trader, you should care about resistance lines even if all you ever do is buy stocks first, then sell them later. True, as a buyer, the support line is your main focus. When prices dip below the support line, it usually signals that it is time to sell.
But remember what swing trading is all about. Stock prices rise and fall in (hopefully) predictably patterns or cycles. As a buyer, you want to buy at the lowest possible price. That means getting in just as the stock is about to rise. That also means looking for signals that a downtrend is about to reverse course to become a new uptrend.
Hence, the buyer should also care about identifying downtrends using resistance lines because, when the downtrend ends, the next move may very well be an uptrend. So if you want to get in on the action as early as possible, you need to observe when a downtrend breaks to the upside. A breakout is a potentially powerful signal that an uptrend may be starting and that you should pay attention.
It goes without saying that if you plan to sell short, paying attention to downtrends and resistance lines is critical. Selling short is inherently more risky: you sell a financial instrument first and then buy it back later at a lower price. But since prices theoretically have unlimited upward potential (while limited to the downside at $0), selling short is not a transaction one should rush into willy-nilly.
However, if you strive, as you should, to be emotionally neutral about whether prices rise or fall, why shouldn't you try to profit in both directions? To profit only on price gains is to miss out on 50% of the opportunity presented by trend-based trading. Commodity traders know this well. They tend to be more familiar with this practice than stock traders.
Consider the following chart:
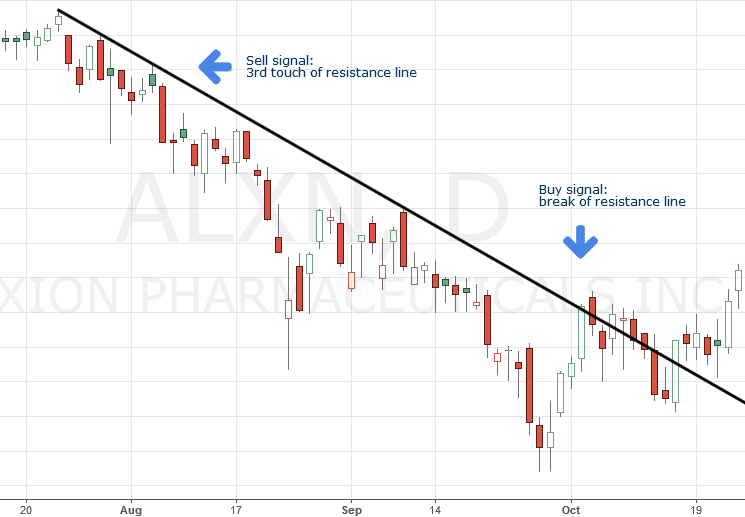
ALXN stock chart with entry on 3rd touch of support line, and exit at break of support line.
This stock is in an obvious downtrend and offers an opportunity for short selling. As can be seen, its downward sloping trend line acts as a resistance line for over two months.
Entry and Exit Conditions
According to the 3-touch resistance strategy, you are to sell (short) financial instruments right after the third touch of prices to the resistance line, and buy (close out the short position) when resistance is broken to the upside.
With ALXN, this means selling the stock after Aug. 5 and buying it back once prices breach the resistance line on Oct. 2.
Here's another chart:
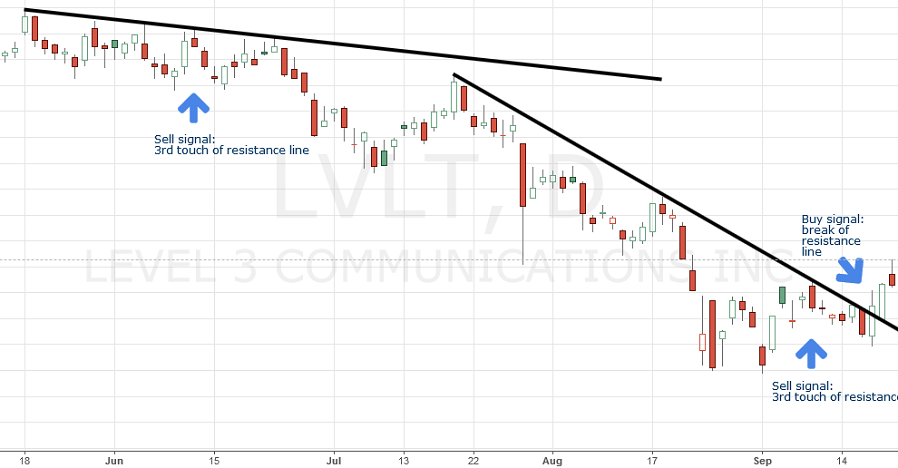
LVLT stock chart with two entry points on 3rd touch of two separate support lines, and exit at break of second support line.
Generally speaking, trend lines with shallow slopes are much more risky to use than those with steeper slopes. Mentally subtract the top trend line so you can more clearly see how the prices beneath it are almost moving in a horizontal fashion. Almost. The trend line may be shallow, but it is nevertheless downward sloping.
A trader willing to take on the greater risk would, following the 3-touch resistance strategy, short this stock when prices retest the resistance line for the third time on Jun. 11. The gamble pays off: in July, the stock's price begins a precipitous decline. It never returns to this resistance line. Instead, the opportunity arises to draw a new resistance line, this time with a much steeper slope.
The experienced trader would see this new line as an opportunity to increase his short position. With a new trend in play, the trader following this strategy would wait for a new third touch of prices. This occurs on Sep. 9. Unfortunately, six trading days later the resistance line is tested for the sixth and final time. Resistance fails. The trader would immediately cover his most recent short position, most likely breaking even or at a slight loss. But there is also the first short position which, if covered, would bring him in a tidy profit. The prudent thing to do would be to sell at this time as well. Since the slope of the first resistance line is slight, a quick rise in price with a breach of that line would not be nearly as profitable to the trader.
Resistance and Support
The logic for using resistance lines for trading is the same as for support lines, only in reverse. The more times daily highs touch the resistance line but fail to cross it, the more confidence you can have that it accurately reflects the trend.
Such tests of resistance encourage sellers of the stock to sell more after the price passes the test. Using terms from economics, fresh selling constitutes supply of stock and is called distribution. Owners of the stock are reluctant to hold it after the resistance line resisted the effort by traders to break above it. They are willing to sell their inventory of stock at increasingly lower prices.
In sum, using resistance and support exemplifies the main principle of trend-based trading: never enter at the absolute high, and never exit at the absolute low. The goal is to capture a sizable portion of the prevailing trend. Keep in mind that you will rarely profit from all of it. Since you cannot accurately predict when a trend will begin or end, you should more modestly shoot for the middle third of the move.
Like this strategy? Here are a few more.
Or start building a complete trading system around it today.